A data-driven approach to transit planning and equity
June 04, 2024
June 04, 2024
Discovering how people actually use transit—and how to change it for the better
Gig work, hybrid work, work from home, and industrial parks are all shifting the way we move and use our cities. This has created demand for travel beyond the traditional downtown commute. There is a large portion of the population whose primary travel is outside the city core to meet their daily needs or to enjoy increasingly lively suburban nightlife options like restaurants and microbreweries. Transit service has a monumental challenge to keep up.
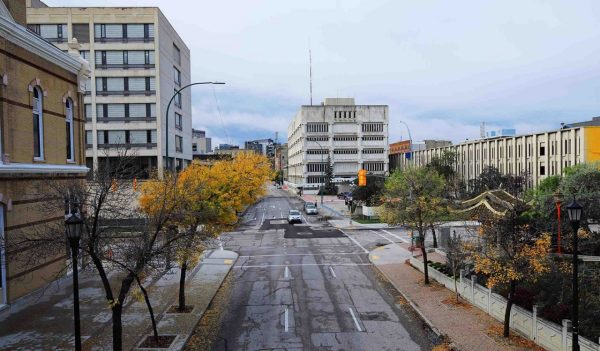
In Winnipeg, Manitoba, where temperatures can reach -40C (-40F) in the winter, having reliable transit options is an equity issue. And it’s an important socioeconomic question for the city. People who struggle to get to work, access essential needs, and care for family can’t participate in society as they should.
When Winnipeg Transit tried to chart its course for the next 25 years, it was open to new ideas. The city wanted to create a master plan that maximized the potential of conventional, specialized, and rapid transit. It also wanted to look at the infrastructure to support it. It’s not easy to understand ridership patterns. However, knowing those patterns is key to providing the best recommendations. To get the best information available for Winnipeg, our team married data and engagement in innovative ways, while ensuring that equity was baked into the plan from the beginning.
The key to a new transit plan for the City of Winnipeg, Manitoba, was was using data to understand how to support the existing mobility needs of all people, ages, and abilities.
What we discovered was a bit shocking. Let’s dig in.
First, we’ll discuss Winnipeg’s transit history. Then, we’ll look at the importance of stakeholder engagement on the current plan. Followed by how data led us to this updated master plan.
Winnipeg has always been a transit pioneer. It was one of the first cities in North America to build an electric tram system, starting with a streetcar along River Avenue in 1891. This kicked off a half-century of experimentation. Over the years, changes included new routes and technologies, like gasoline-powered buses and trolley buses.
Winnipeg’s transit system has evolved over more than a century, but the basic structure of the service model and route map has not changed for several decades. Faced with increasing public pressure that highlighted the changing mobility needs of Winnipeggers, the transit service took bold steps to address the changing demand. Refusing to settle for small changes that would have a small impact, Winnipeg Transit opted to explore the possibilities that a fundamental change could bring to the service.
Like all cities, Winnipeg has a segment of its population that needs transit but struggles to access it. Socioeconomic challenges are made worse by Winnipeg’s transit map. Several municipalities were joined in the 1970s, resulting in a spread-out city with multiple community cores. Many trips are suburb to suburb rather than through the downtown. However, Winnipeg runs a hub and spoke model, with most of the service connecting to downtown. This created an equity issue, where transit was not always an effective mode to get to grocery stores, schools, jobs in industrial parks, or doctor’s offices.
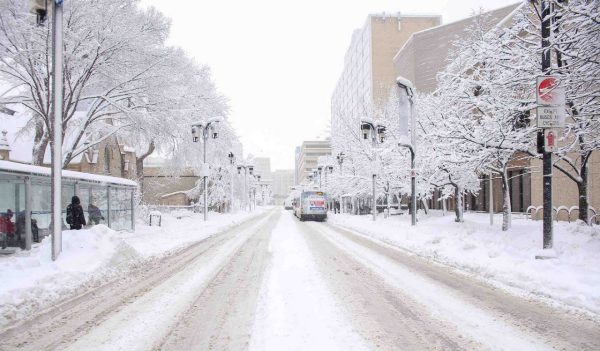
Winnipeg is a winter city, with temperatures that drop to -40C (-40F). A reliable transit system is essential for the community.
Winnipeg Transit wanted a better solution. It was looking to
How can we hit those marks?
We looked at data-driven, comprehensive transit planning and advisory guidelines. The key here was using data to understand how to support the existing mobility needs of all people, ages, and abilities. And to do so in the most sustainable, cost-effective, and reliable manner.
Our team used three steps to look at the data. First, we dug into confidential, anonymized cellphone data. Then, we conducted a deep analysis of transit system information. And, finally, our team undertook extensive stakeholder engagement in our planning approach.
Our team engaged with a wide cross section of Winnipeggers. From people at senior centers to community centers, engagement was inclusive. Winnipeg is one of the most multicultural cities in Canada, and that includes languages spoken. Public engagement meetings were always held in both English and French—and sometimes Cree. We had to watch for engagement fatigue (it’s a real thing!), and planned sessions to piggyback on existing events or public meetings.
To design our transit solution, we combined our public engagement program with structured data collection and analysis processes.
We really focused on education. We started out with more blue-sky conversations around transit needs, wants, and goals. This built a foundation to get better feedback over time and buy-in on the planning process. There was no presentation of three or four options to choose from; all recommendations started with the community.
Talking with members of the community, we learned that they demanded a well-integrated transportation network. It needed to provide mobility options to build economic opportunity and improve quality of life. Residents want reliable access to jobs, services, and recreation opportunities. And they want it without having to rely on private vehicles.
To design our transit solution, we combined our public engagement program with structured data collection and analysis processes. We used anonymized smartphones and open-source data to examine movement patterns throughout the city. This allowed us to recommend ways to mold the transit system to meet those patterns. And we developed a unique methodology. This included using the movement data and incorporating passenger loading data from Winnipeg Transit combined with household income data and economic activity from employment and sales data.
We needed a strictly analytical approach to confirm or replace assumptions that had influenced transit services development for many years. When people had a choice, what was their destination, and how did they get there? The key finding surprised a lot of people: downtown was not the focus of the city. The transit system had been built to make most connections in the downtown core, meaning people had to go well out of their way to get to their destination. By tapping into peoples’ actual movements, we found the true pulse (pulses, actually) of the city and identified key movements and gaps in service.
To communicate our solutions to stakeholders, we had to visualize the data in a simple, understandable format. How did we do it? The study team created a bespoke analytics dashboard and map. Stop by stop, route segment by route segment, Winnipeg Transit could see how people were using the system. This told the true story of transit and how people used it. This was also useful in showing transit users how we took their input, used data to understand what was happening, and married the two to make our recommendations.
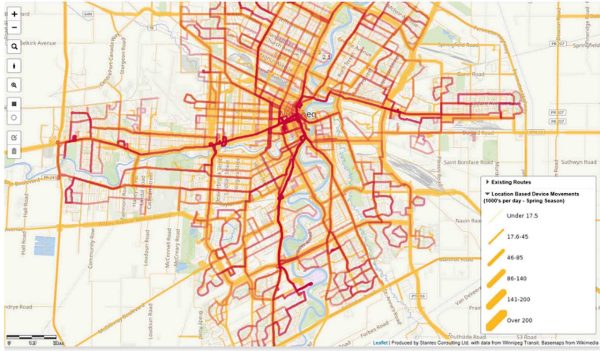
Stantec’s analytics dashboard for Winnipeg. The yellow lines reflect vehicle volumes. The red lines represent the transit ridership map identifying gaps between how people move in the city and where transit is provided.
The resulting transit plan was a layered network, where each layer has a defined service and strategy: express, frequent, or direct service. Bus routes were set up to go near grocery stores and commercial areas outside of downtown so people wouldn’t have to walk for miles. The plan was about getting people to places they use in their daily lives, not necessarily about that big commute downtown. Being more intentional about transfers was another key strategy—getting to a new area of the city and then connecting locally. We created a whole infrastructure chart based on services and transfers and the infrastructure required to improve transfers. Route designs fit a neighborhood’s purpose, and they fed into a new network design that was better in line with the mobility people were looking for.
With a layered network like this, it’s easier to make quick responses to changing needs. And it creates a more reliable service for those depending on transit. A more layered system is defined by efficiency, frequency, reliability, safety, equity, and environmental sustainability.
When you see a big line of cars, why are they there? Where are they going, and why are they stuck? There may be congested roads with no bus service or the wrong kind of service. That was the case in Winnipeg, where transit wasn’t fully meeting the mobility needs of the present and future residents. People who needed transit were being forced to take a bus all the way downtown to connect to their destination, which might only be 10 minutes away by car.
Using a data-driven process identifies the true nature of our transit and transportation systems. Those systems can also include pedestrian movements, bike corridors, and other factors. Data helps us understand how people really want to get around and how we can accommodate that. As efficiently and equitably as possible.
If you’re looking to improve transportation in the community, consider a data-driven process. You might be surprised at what you find.