Satellite technology provides a new way to assess historic pipeline releases
October 08, 2020
October 08, 2020
As the ongoing COVID-19 pandemic limits us from physically putting experts in the field, Remote Sensing technologies like PipeWATCH are essential
Thanks to remote sensing, we’re already using satellites to monitor pipelines buried beneath the Earth’s surface. But now, our proprietary PipeWATCH technology has given us a new, unique perspective on pipelines by giving us a new way to assess and monitor the historical locations of an accidental release.
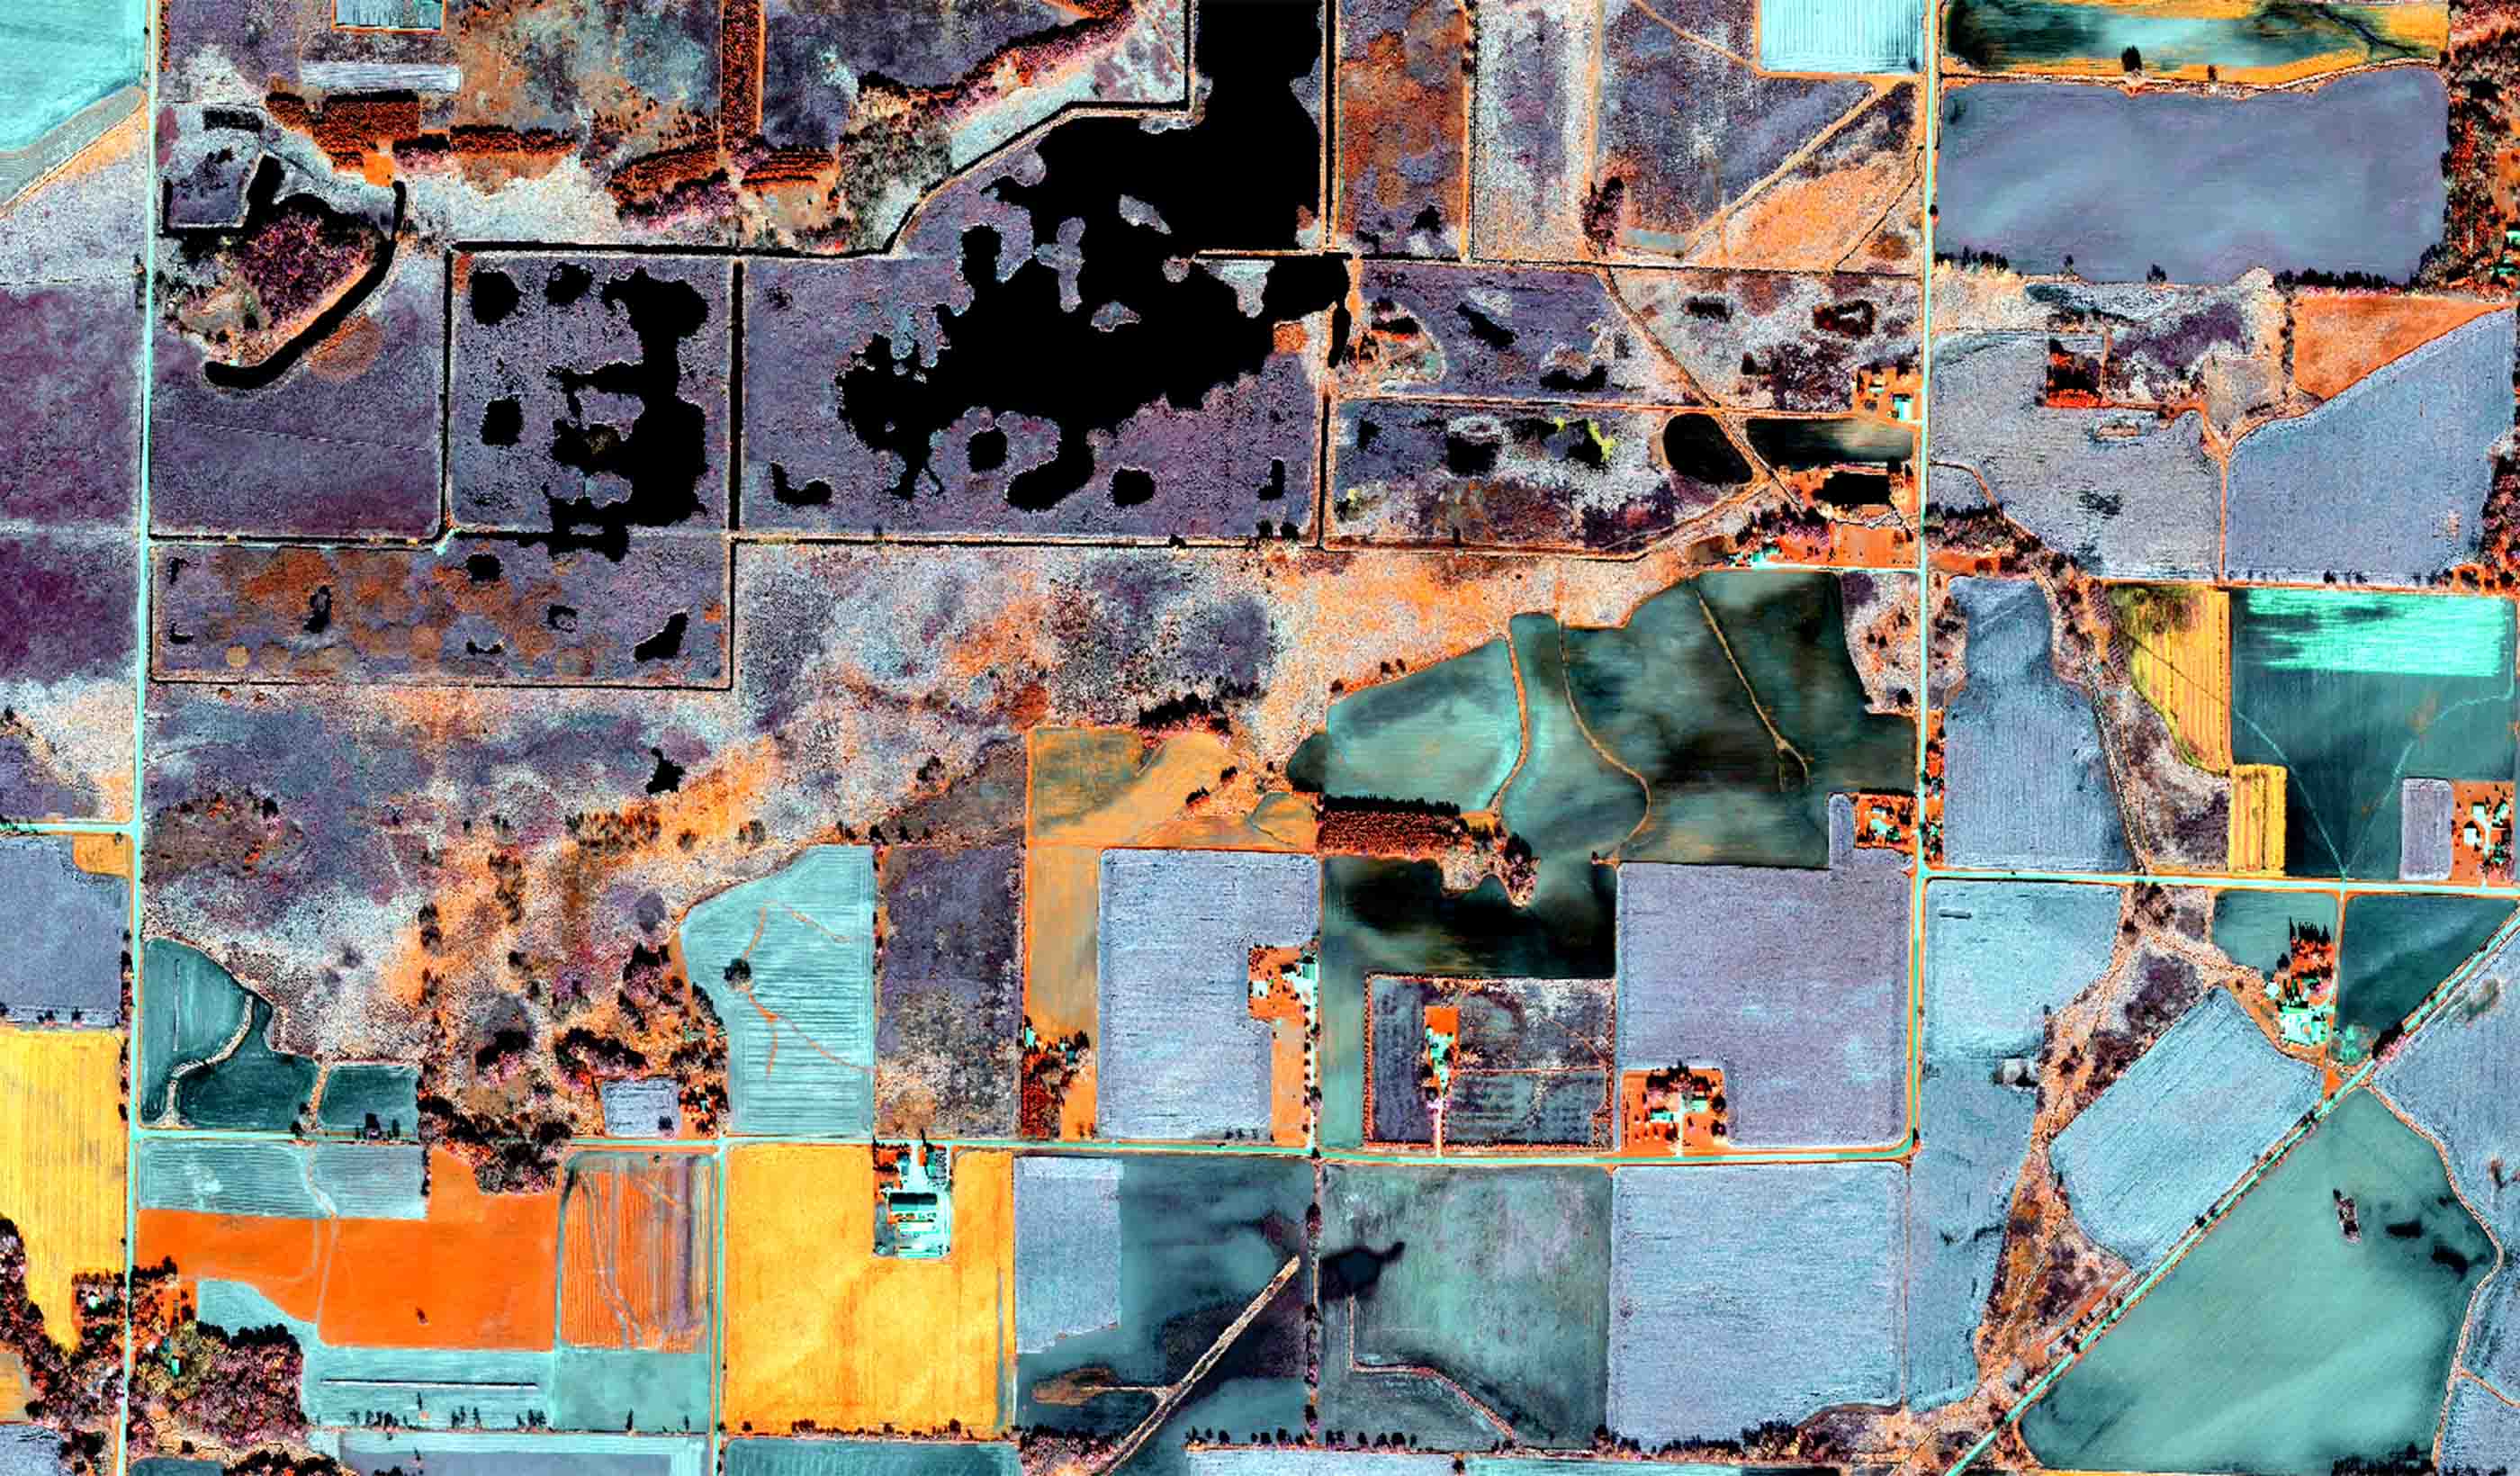
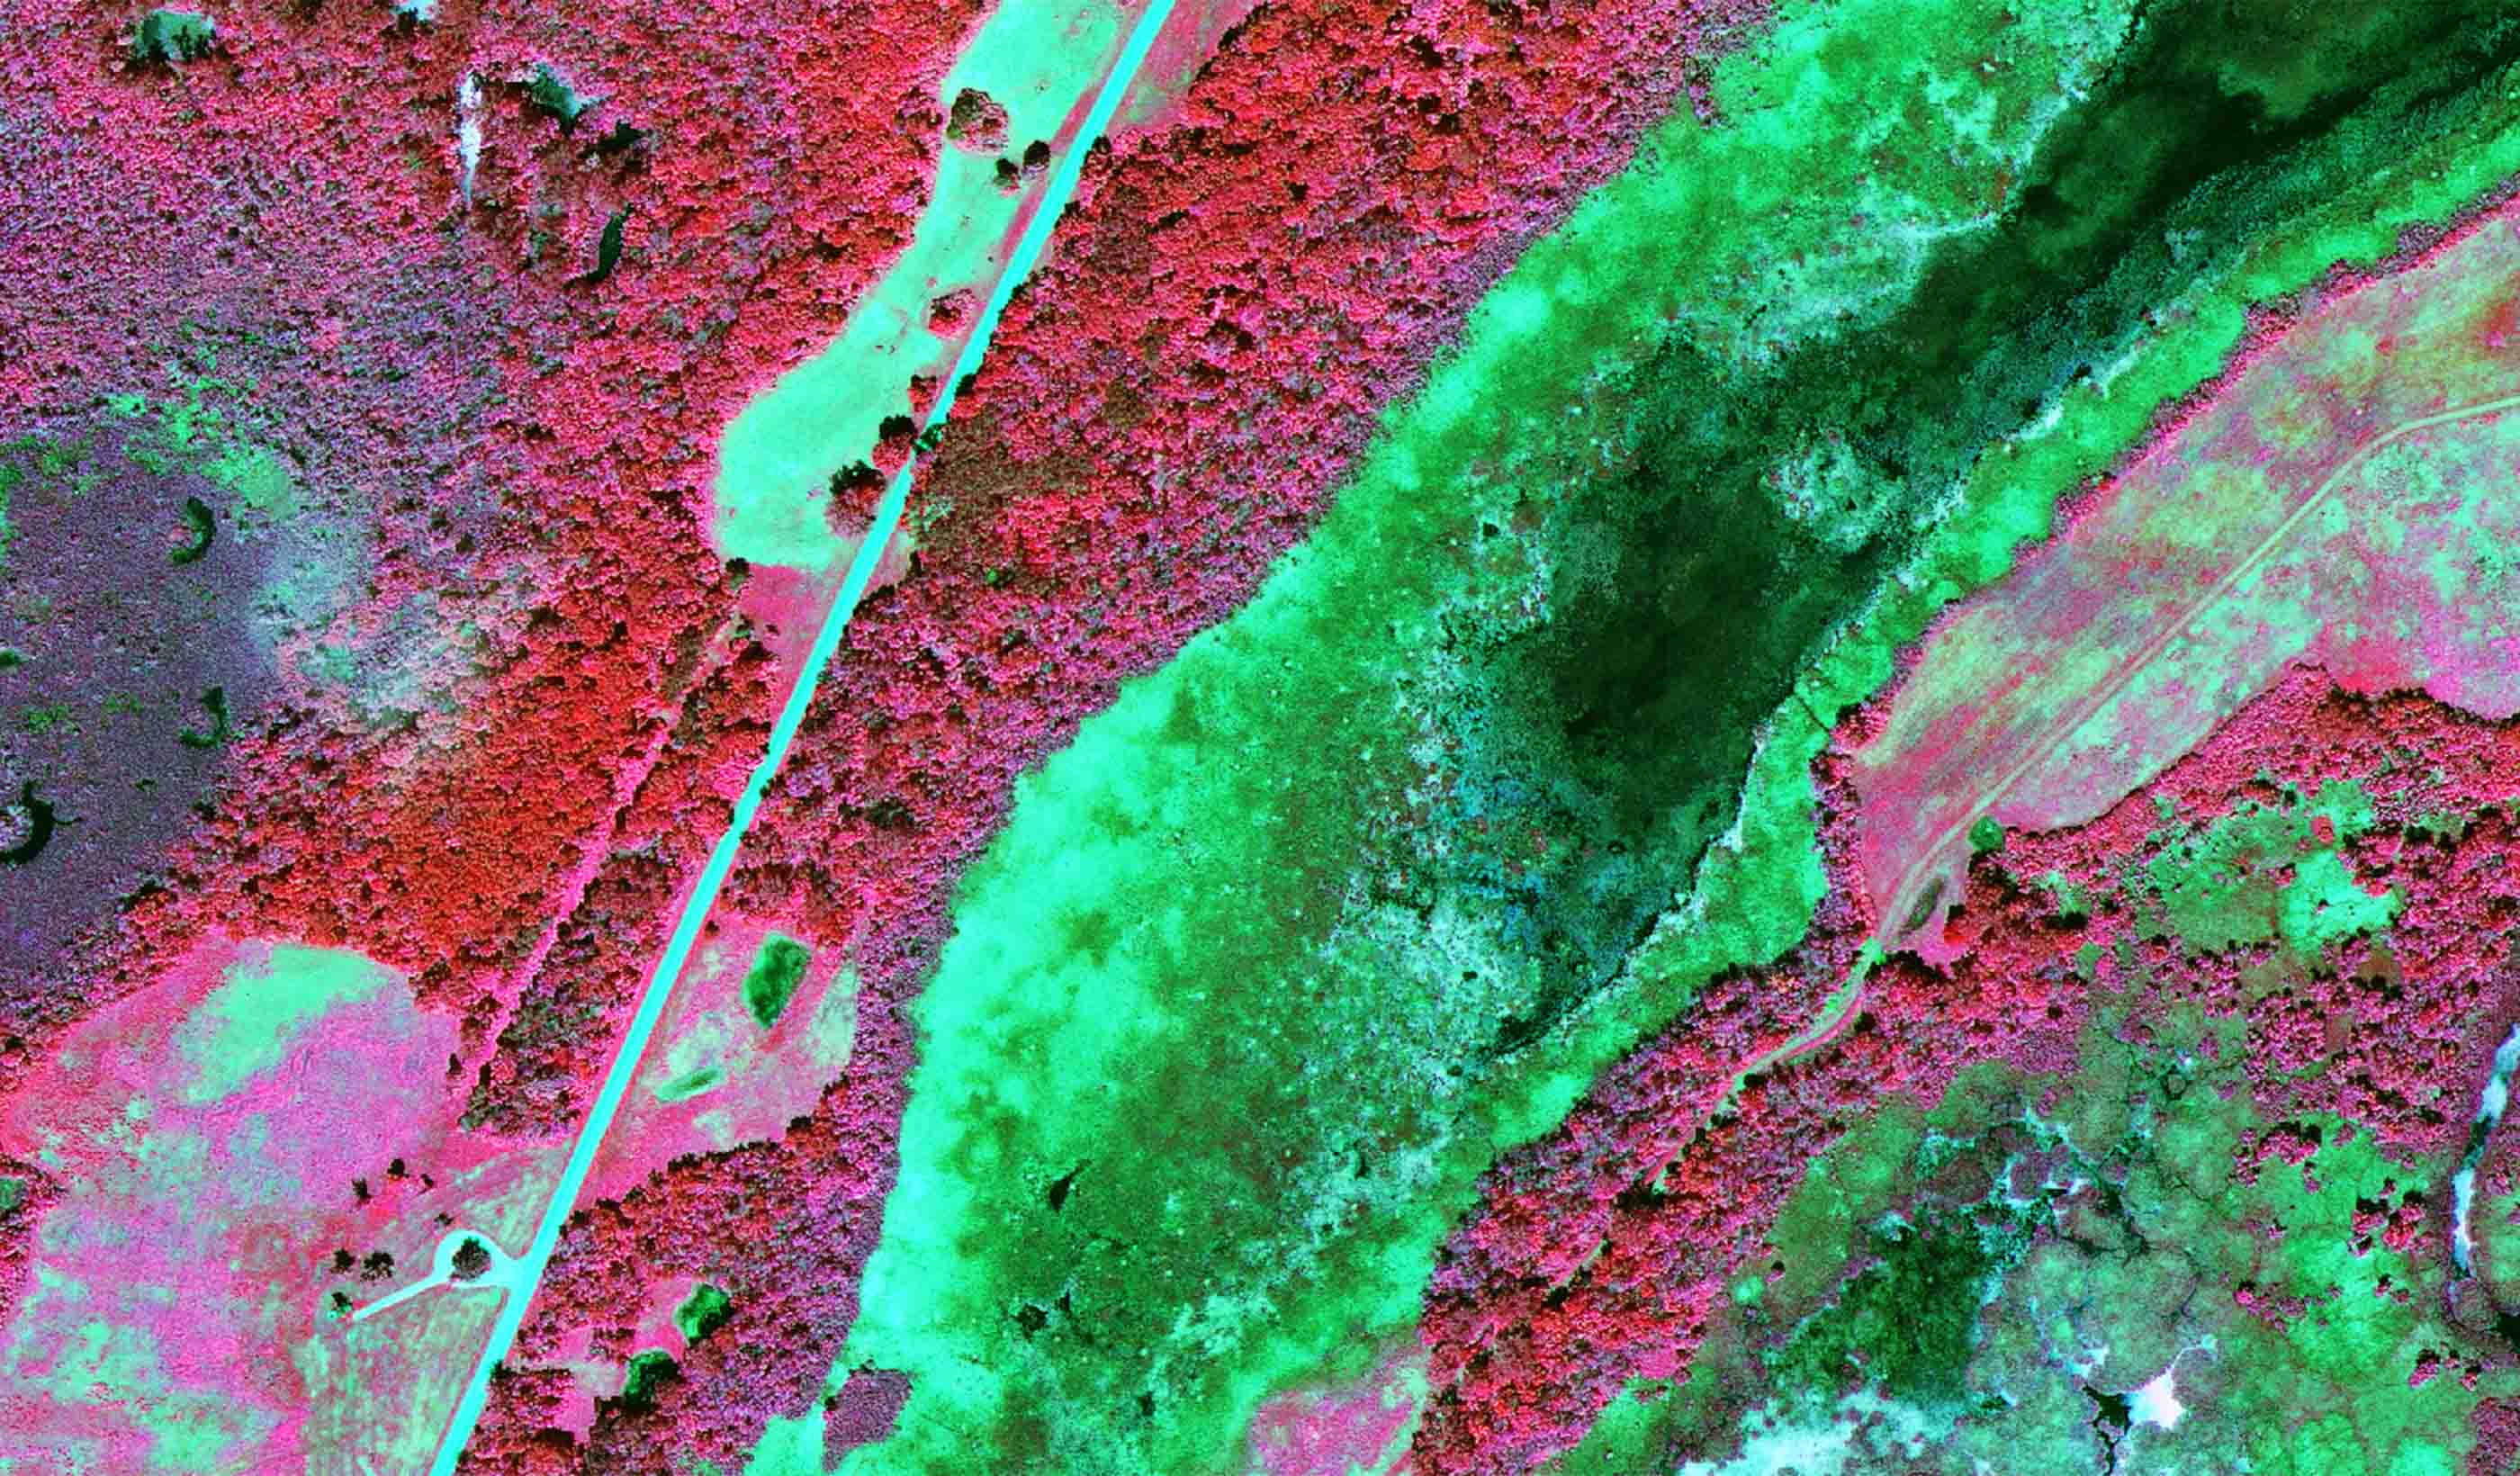
First a recap. In my first blog on PipeWATCH, I explored how we collect imagery of pipeline rights of way (RoW) from a constellation of dove satellites orbiting Earth. These small satellites collect RBG (red, blue, green) and near-infrared signals. Combined, these signals can give us very detailed information about the health and vigor of any vegetation on Earth’s surface, including the vegetation in the entire length of a RoW.
Using PipeWATCH, we download the images and calculate vegetation indices. The next day, when a satellite scans that location again, we automatically generate vegetation health values and perform a change-detection analysis. If we see a drop in the health of the vegetation, that raises a red flag. It could be due to an accidental release.

Thanks to remote sensing, we’re already using satellites to monitor pipelines buried beneath the Earth’s surface.
In that original blog, I wrote that PipeWATCH is such a game changer because it’s not just a “where” technology but a “where and when” technology, one that lets you look at things in near real time—like the accidental release from a pipeline.
PipeWATCH and our other Remote Sensing technologies are also essential today, as the ongoing COVID-19 pandemic limits us from physically putting experts in the field. Satellite technology now enables our team to monitor projects and maintain schedules without risking unnecessary viral exposure.
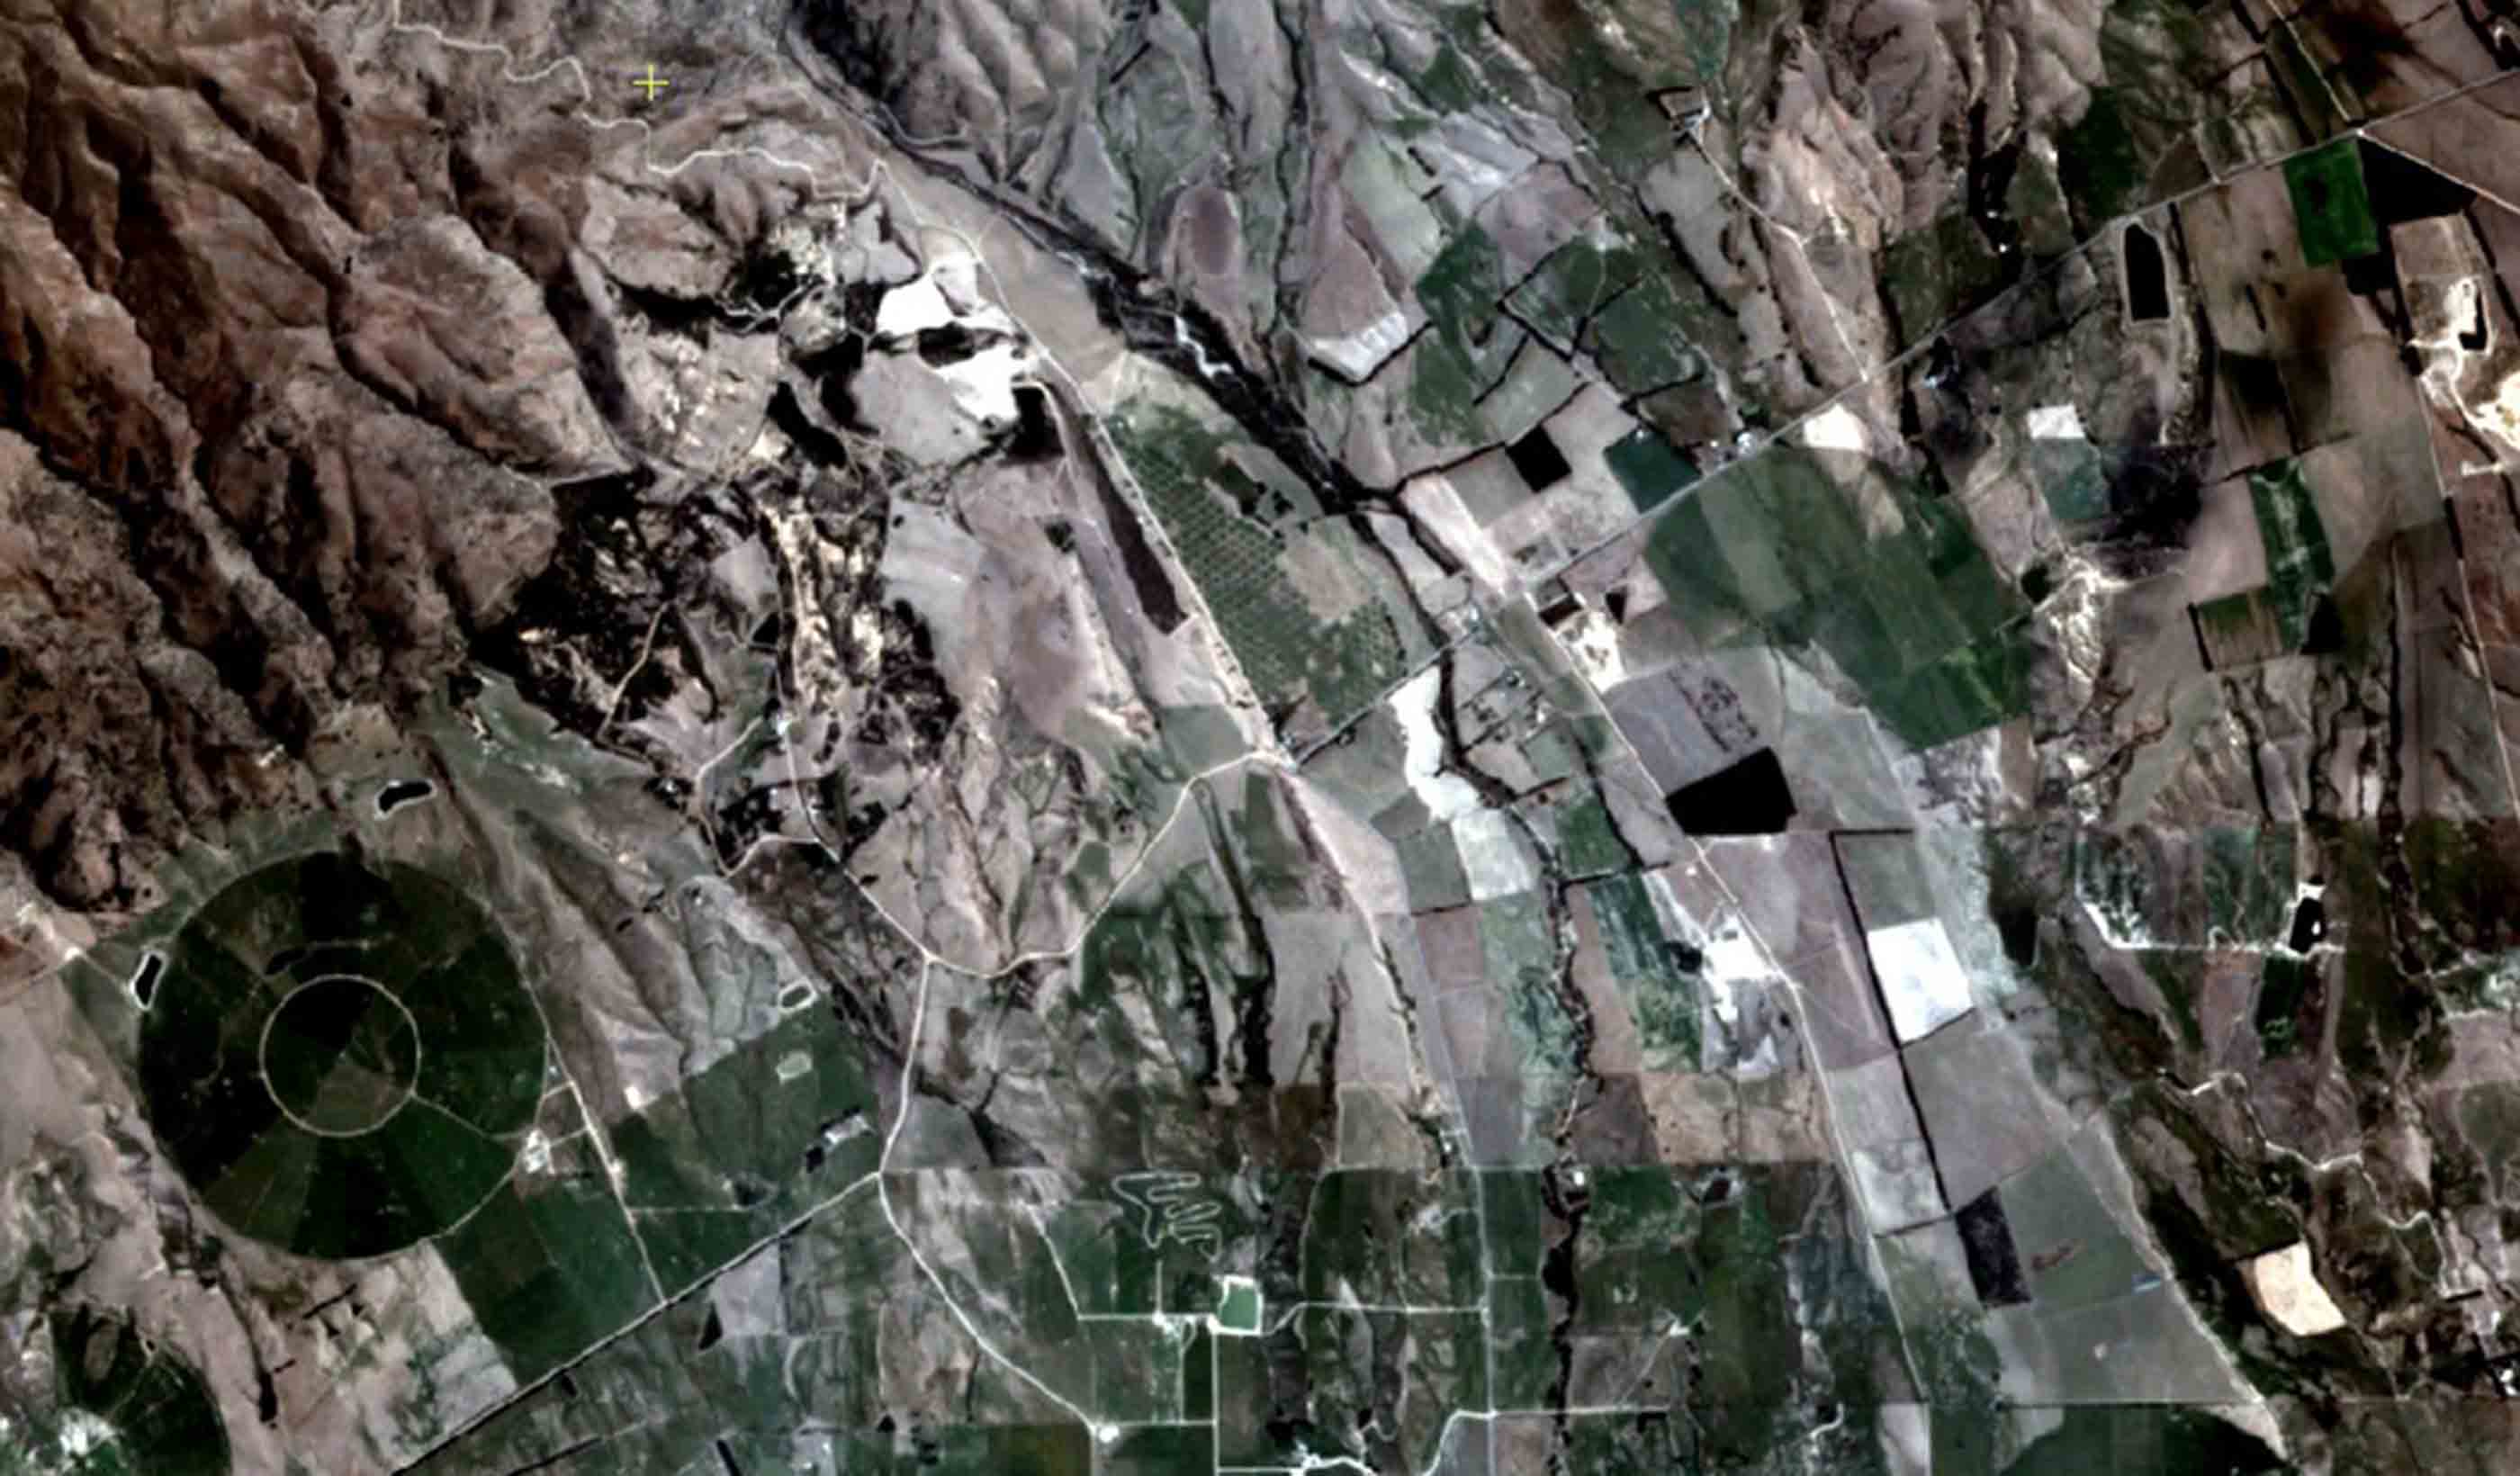
But now, we can utilize similar data to look back even further—not just months or years but several decades. Satellites have been collecting data going back as far as 1972. And we can use that data to examine the ongoing impact of accidental releases. How did we use this data?
Investigating the sites of historic releases is just one more way that remote sensing technologies—and PipeWATCH—are proving to be game changers for industries conveying hazardous liquids.
We had a client interested in purchasing a pipeline. But, along that pipeline, there had been several releases recorded going all the way back to the 1950s. The client wanted to know the residual impact of those releases to evaluate the potential cost for rehabilitating the land along the pipeline.
Thanks to our archive of satellite imagery, we were able to travel back in time (i.e., hindcast). By running change-detection analysis of the vegetation indices along the pipeline right-of-way, we identified vegetation recovery along the segment where the accidental release had occurred. We use the health of the recovered vegetation as a metric to determine if spill site reclamation efforts have been, or are being, effective in restoring the environment to its original state.

Investigating the sites of historic releases is just one more way that remote sensing technologies—and PipeWATCH—are proving to be game changers for industries conveying hazardous liquids.
What might historical contamination look like in our analysis? It could be bare soil, where nothing could grow, or dramatically less biomass, such as grasses, shrubs, and trees. Or we might see that a contaminated area might only produce grasses, while closer areas can support shrubs or trees.
In our traditional use of PipeWATCH technology, we actively look for pipeline releases by performing change-detection analysis of vegetation at the same physical location. When we look for the impacts of historic releases, however, we’re using the data a little differently, by looking for contamination change. When we’re looking at a known release site, versus locations with sound integrity, we’re really comparing “apples to apples,” so to speak.
We also took those readings and compared them to similar vegetation along the pipeline for cross-comparisons of vegetation health where no release had occurred. In this way, this analysis showed that there were no residual impacts to vegetation health from the known historic release sites.
Now, if we had looked at a historic release site where we were still seeing signs of contamination, we would have been able to focus in on those specific areas rather than sending field crews out to 20 or 30 potential historic release locations.

Satellites have been collecting data going back as far as 1972. And we can use that data to examine the ongoing impact of accidental releases.
Investigating the sites of historic releases is just one more way that remote sensing technologies—and PipeWATCH—are proving to be game changers for industries conveying hazardous liquids.
Who else might benefit from using PipeWATCH to examine historic release sites? If you’re an operator who has had an accidental release, this could be the solution for you to ensure that your rehabilitation efforts are proving effective. You may already own conveyance assets and want to understand the ongoing impacts of a historic release. Whatever the reason, PipeWATCH lets us look to the past to focus on the future.
To learn more about PipeWATCH and how our remote sensing technologies might be right for your project, contact me.